We live in a data-driven world, where decisions are constantly influenced by information. For example, when we shop online, we often check customer reviews, compare prices, and choose sellers offering discounts- all based on data that guides our choices.
Similarly, businesses rely on data to drive their decisions, using it to identify trends, enhance customer satisfaction, and respond to evolving demands. But without the right tools, leveraging data effectively can be a challenge.
This is where Microsoft Power BI comes in. As a leading business intelligence solution, Power BI empowers businesses to transform raw data into visual insights, enabling smarter, data-driven decisions.
In this blog, we’ll explore Microsoft Power BI in depth and discover how it can drive growth and efficiency in your business.
What is Microsoft Power BI?
But what exactly is Microsoft Power BI?
Microsoft Power BI is a business analytics tool that enables organizations to visualize data, share insights, and make data-driven decisions. It is part of the Microsoft Power Platform suite and integrates seamlessly with various data sources, including Excel, databases, cloud-based services, and custom APIs. Power BI helps businesses transform raw data into visually compelling, interactive dashboards and reports, making it easier to track performance, identify trends, and improve decision-making.
Components of Power BI
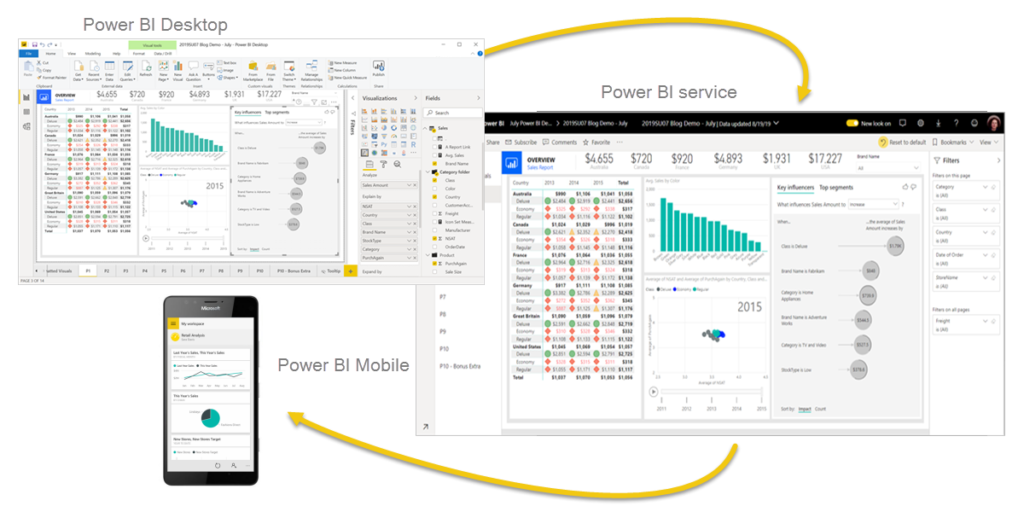
- Power BI Desktop: A downloadable application designed for comprehensive report building and data visualization. Ideal for data analysts and advanced users, Power BI Desktop allows for in-depth exploration of data, transforming raw information into detailed, customized reports.
- Power BI Service (Cloud): A web-based service for sharing, publishing, and collaborating on reports and dashboards. With the Power BI Service, users can access, interact with, and share reports online, enhancing team collaboration.
Power BI Mobile: A mobile app that enables data access and report viewing on mobile devices. Executives and remote workers can access key metrics and dashboards in real-time from any location, supporting flexible, data-driven decision-making.
Power BI’s flexibility makes it a valuable tool for organizations of all sizes, whether they are analysing financial data, customer insights, or operational performance.
Key Features of Microsoft Power BI
Now that you understand what Microsoft Power BI is, let’s dive into what truly sets it apart. Power BI brings a powerful suite of features designed to meet the diverse needs of businesses, from data visualization to real-time analytics. Let’s explore the key features that make Power BI such a valuable tool:
- Data Visualization: Power BI provides a wide selection of data visualization tools, including bar charts, pie charts, line graphs, and geographic maps. These visuals help users convert complex datasets into intuitive graphics, making data insights clear and actionable.
- Customizable Reports and Dashboards: With Power BI, users can build custom dashboards that cater to the needs of different audiences, whether executives, sales teams, or marketing departments. The drag-and-drop interface allows users to create compelling, personalized reports.
- Real-Time Analytics: Businesses often need to make decisions quickly, and Power BI’s real-time analytics allows them to do just that. By connecting to data sources that update in real-time, Power BI dashboards reflect changes as they happen, ensuring teams have the latest information.
- AI and Machine Learning Integration: Power BI includes AI-powered insights, allowing users to identify patterns and trends without requiring extensive data science knowledge. These AI features enable predictive analytics, helping businesses anticipate future trends based on historical data.
- Collaboration Tools: Collaboration is a core feature of Power BI. Teams can share reports and dashboards directly within the Power BI platform or through Microsoft integrations like Teams and SharePoint, allowing users to collaborate in real time.
- Mobile Access: With Power BI’s mobile app, decision-makers can access data on their phones or tablets, ensuring they have up-to-date insights even when away from the office. This accessibility is particularly beneficial for remote teams and executives who travel frequently, as it allows them to view and interact with key metrics on the go.
These features provide a foundation for advanced data analysis, enabling businesses to make data-driven decisions faster and more effectively.
How Microsoft Power BI Benefits Businesses
It’s time to finally explore the benefits of Power BI. Power BI provides numerous benefits to businesses, enhancing data-driven decision-making, improving operational efficiency, and fostering collaboration across teams. Let’s take a closer look at how Power BI can help transform your business processes and drive growth:
Enhanced Data Visualization and Reporting
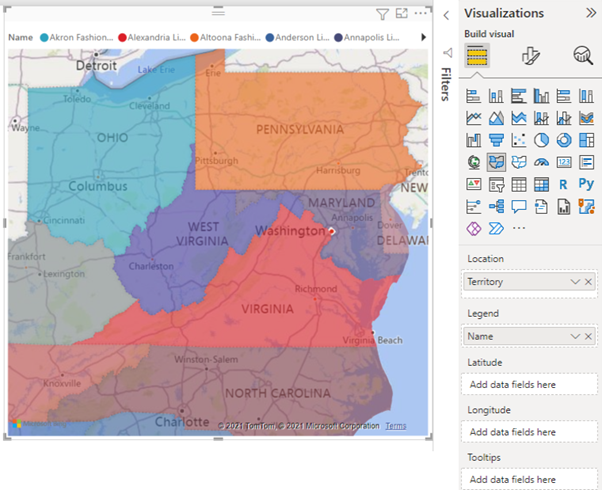
Visual representation of data is one of Power BI’s strongest suits. Rather than sifting through rows of numbers, Power BI allows users to view data visually with interactive charts, graphs, and maps. This makes complex information digestible, enabling faster understanding and insight.
For example, a sales team might visualize quarterly performance by region, using color-coded maps to see which areas are hitting targets. With Power BI’s real-time data integration, the team sees updates as new sales come in, helping them pivot strategies if needed.
Improved Decision-Making
Power BI’s data-driven insights empower leaders to make smarter decisions. By compiling data from multiple sources into a single dashboard, Power BI enables businesses to see a full picture and respond accordingly.
Let’s look at a few examples:
- Finance: A CFO can quickly visualize revenue trends and compare them against forecasts.
- Operations: Operations managers might monitor supply chain metrics in real time, identifying bottlenecks before they impact production.
- Marketing: Marketing teams use Power BI to track campaign performance, comparing ad spend against engagement metrics.
Through built-in AI and machine learning, Power BI can even offer predictive analytics, forecasting trends based on historical data.
Cost and Time Efficiency
Self-service analytics enable team members, regardless of technical skills, to explore data independently. Power BI’s intuitive drag-and-drop interface and customizable templates make it easy for non-technical users to create reports without requiring IT support.
Additionally, Power BI’s automated data refresh feature saves time, ensuring that dashboards always display the latest information. For small businesses, Power BI Desktop offers a free solution, while Power BI Premium scales for larger enterprises, making it affordable and flexible.
Key Business Applications of Power BI
With a clear understanding of Power BI’s benefits for your business, let’s explore some real-world applications of this powerful tool within your organization.
Power BI for Sales and Marketing
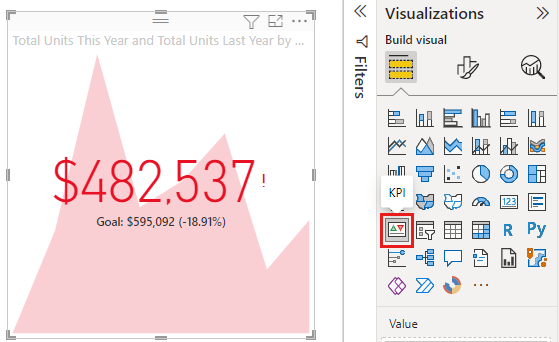
Sales and marketing teams can use Power BI to monitor key performance indicators (KPIs) like customer acquisition cost, sales revenue, and campaign performance. By visualizing data from customer relationship management (CRM) systems, Power BI helps these teams understand customer behaviour and identify trends.
For instance, a marketing team could track the performance of a new advertising campaign, using a Power BI dashboard to monitor engagement, click-through rates, and conversions. Sales teams might use Power BI to analyse sales by region, product, or customer segment, enabling them to focus on high-potential areas.
Power BI in Finance
In finance, Power BI provides detailed financial dashboards that track metrics such as revenue, profit margins, and expenses. With these visual tools, finance teams can create custom reports that visualize monthly expenses alongside revenue projections, giving CFOs a comprehensive view of the company’s financial health.
Power BI’s forecasting tools also help finance teams make better budgetary decisions by analysing historical spending patterns. For example, finance teams can set up alerts for unexpected expenses, enabling them to take corrective action and maintain budget control.
Power BI for Operations and Supply Chain Management
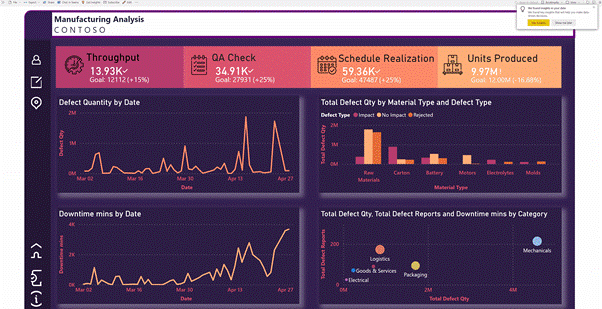
Power BI provides valuable insights into supply chain and operational efficiency. With real-time tracking capabilities, supply chain managers can monitor inventory levels, logistics performance, and supplier lead times. This visibility is essential for identifying bottlenecks, delays, and inefficiencies that could impact production schedules and customer satisfaction.
For instance, a logistics manager might use Power BI to analyse delivery times and identify trends, helping them improve on-time delivery rates. Operations teams can track production metrics, such as units produced per hour, enabling them to optimize production processes.
Power BI in Human Resources (HR)
Human Resources (HR) teams use Power BI to track workforce metrics like employee engagement, turnover rates, and productivity. These insights are critical for understanding employee trends and enhancing organizational management.
An HR team might set up a dashboard to monitor onboarding efficiency and training completion rates, allowing them to streamline the process. Additionally, recruitment teams can analyse data from job applications to determine the most effective recruiting channels and optimize hiring practices.
Security and Compliance with Power BI
When introducing a new tool within an organization, leaders often prioritize data security and protection. Ensuring that sensitive information remains safe is essential. If you’re considering implementing Power BI, understanding its security and compliance measures is crucial.
Microsoft Power BI is designed with a comprehensive security framework that protects sensitive data at every stage, from data ingestion to report sharing. With built-in compliance features and robust access controls, Power BI aligns with industry standards to safeguard information across organizational environments. Let’s explore Power BI’s key security and compliance features in detail:
1. Multi-Layered Security Architecture
Power BI employs a multi-layered security model to ensure that data is protected from unauthorized access. This includes data encryption at rest and in transit, along with the enforcement of security controls across networks, data storage, and report access.
- Data Encryption: Power BI encrypts data both in transit (while data is being transferred between the source and Power BI) and at rest (while data is stored in Power BI services), ensuring comprehensive data protection.
- Network Security: Power BI uses advanced network security controls, including secure connections via HTTPS, Virtual Network Service Endpoints, and private links for greater control over data flow.
2. Row-Level Security (RLS)
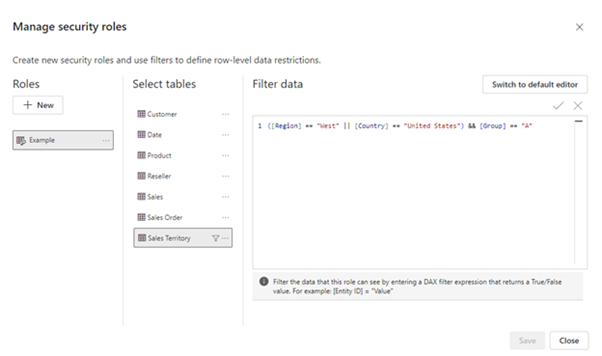
Row-Level Security allows organizations to restrict data access at a granular level by defining roles that limit what each user can view within a dataset. By applying RLS, administrators can ensure that employees only access data relevant to their specific roles and responsibilities, minimizing the risk of unauthorized data exposure.
3. Compliance with Industry Standards
Power BI is compliant with major industry standards and certifications, including:
- GDPR (General Data Protection Regulation): Ensuring data protection and privacy for organizations handling EU citizens’ data.
- HIPAA (Health Insurance Portability and Accountability Act): Making Power BI suitable for healthcare organizations managing sensitive patient data.
- SOC 1 and SOC 2: Covering controls relevant to financial reporting and data security, respectively.
- ISO/IEC 27001: Ensuring an international standard for information security management.
These certifications demonstrate Power BI’s commitment to maintaining high standards of data protection and compliance, making it suitable for use in highly regulated industries.
4. Data Loss Prevention (DLP)
Power BI’s Data Loss Prevention (DLP) capabilities allow administrators to set policies that control data sharing and prevent sensitive information from being shared inappropriately. This feature helps organizations monitor and mitigate risks associated with data leaks, maintaining control over critical business information.
5. Integration with Microsoft Information Protection (MIP)
Power BI integrates with Microsoft Information Protection (MIP) to apply sensitivity labels to reports and dashboards. These labels help to classify and restrict access to sensitive data, ensuring that only authorized personnel can access high-security information. MIP integration also allows organizations to maintain consistent data protection policies across all Microsoft platforms.
6. Secure Access Controls and Authentication
Power BI supports advanced authentication and secure access measures to prevent unauthorized access:
- Azure Active Directory (AAD): Power BI leverages Azure AD for secure user authentication, allowing Single Sign-On (SSO) and Multi-Factor Authentication (MFA) for an added layer of security.
- Conditional Access Policies: With conditional access policies, administrators can enforce specific conditions for accessing Power BI resources, such as restricting access to specific devices or geographic locations.
7. Audit Logs and Monitoring
Power BI provides detailed audit logs and activity tracking, allowing administrators to monitor and review user actions within the platform. This transparency aids in compliance reporting and helps detect unusual or unauthorized activity, ensuring quick response to potential security incidents.
8. Secure Collaboration and Data Sharing
Power BI’s security features extend to collaboration, allowing users to securely share reports and dashboards while maintaining control over data access. Administrators can configure sharing settings and permissions to ensure that data remains secure, even when shared across departments or with external stakeholders.
Power BI’s Scalability and Customization
Scalability Across Business Sizes
Power BI is designed to scale with businesses as they grow. Small businesses benefit from Power BI Desktop’s free offering, while larger enterprises can leverage Power BI Premium for more complex analytics and data processing capabilities.
For instance, a small business might analyse customer demographics with Power BI Desktop, while an international company could use Power BI Premium to track global sales and monitor multi-region KPIs.
Customization Options with Power BI
Customization is a major asset for Power BI users. Power BI Marketplace offers a range of third-party visualizations, while Power BI’s development tools allow businesses to create custom visuals and integrations that meet specific needs.
For example, a retailer might develop a custom report that visualizes in-store foot traffic, helping them optimize store layout based on customer movement patterns.
Conclusion
Microsoft Power BI is a versatile and powerful business intelligence tool that empowers organizations to make informed, data-driven decisions. With a wide array of features, including data visualization, real-time analytics, AI integration, and secure collaboration, Power BI enables businesses to extract meaningful insights from their data.
Whether used by small businesses to monitor key metrics or by large corporations to manage complex data landscapes, Power BI’s scalability, accessibility, and customizability make it an invaluable asset in today’s data-centric world. Embracing Power BI is a step towards unlocking the full potential of your organization’s data, transforming information into actionable insights that drive growth and success.
To learn more about how Power Platform can benefit your organization, discover how RPATech, your trusted Microsoft Power Platform Partner, can help you build custom solutions tailored to your unique needs.
Frequently Asked Questions (FAQs)
Power BI can connect to a wide range of data sources, including Microsoft Excel, SQL Server, Azure, Salesforce, Google Analytics, and many others. It supports both cloud-based and on-premises data, allowing businesses to pull data from various systems into a single platform for analysis.
Power BI is highly scalable and offers solutions for businesses of all sizes. Power BI Desktop is free and offers robust analytics capabilities, making it suitable for small businesses. For larger organizations, Power BI Premium provides advanced features like AI capabilities, large data model storage, and increased capacity.
Microsoft Power BI includes strong security features, such as row-level security, data encryption, and integration with Microsoft’s Active Directory for user access control. Additionally, Power BI meets various compliance standards, including GDPR, HIPAA, and ISO 27001, ensuring data protection across industries.
Power BI Desktop can be used offline to create and design reports. However, to share reports or access dashboards through the Power BI Service, an internet connection is necessary. Once published, reports and dashboards can be accessed from any internet-connected device, including mobile phones.
Power BI Desktop is a free application primarily for designing reports and data models on a local machine. Power BI Pro, a subscription-based version, offers collaborative features, including the ability to share dashboards and reports with other users, access cloud-based data, and use advanced analytics features. Power BI Pro is essential for businesses that require team collaboration and cloud storage capabilities.

