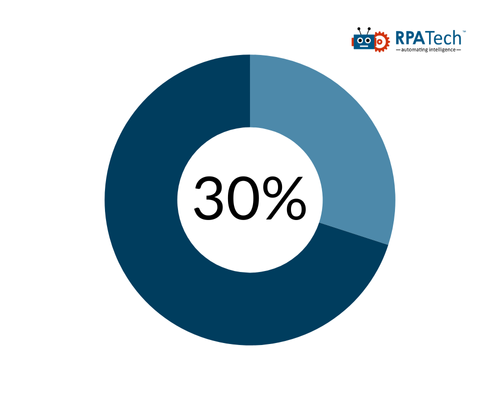
Did you know that approximately 402.74 million terabytes of data are generated every day? Yet, only 30% of this data is utilized by businesses, leaving a staggering 70% untapped.
This highlights the critical need for businesses to harness data analytics tools to transform raw data into actionable insights through interactive visualizations and analytics.

Among these tools, Microsoft Power BI stands out as a game-changer. It enables businesses to convert vast amounts of raw data into meaningful insights, empowering them to make informed, data-driven decisions.
But what exactly is Microsoft Power BI? How can it benefit your business? And where can you apply it to achieve maximum impact?
In this article, I’ll answer these questions and explore 20+ common use cases of Power BI across various industries. These real-world examples will demonstrate how this versatile tool can enhance operations, boost efficiency, and foster a data-driven culture.
Let’s start with the basics.
What is Microsoft Power BI?
Developed by Microsoft, Power BI is a powerful business intelligence tool that allows organizations to connect multiple data sources, build immersive dashboards, and create detailed reports. These capabilities empower decision-makers at all levels to make data-informed choices with confidence.
For businesses striving to stay competitive, effectively leveraging data is crucial for improving operational, financial, and strategic decisions. Power BI offers advanced data visualization and analytics, helping organizations uncover trends, predict outcomes, and drive growth.
👉 Learn more about Microsoft Power BI here.
20+ Common Use Cases of Power BI
Power BI is widely adopted across industries for its flexibility and ability to deliver quick, actionable insights through data visualization and analysis. Below, we’ll dive into some of the most impactful use cases that showcase how Power BI can transform businesses.
1. Sales and Marketing Analysis
Sales Performance Tracking
Power BI enables sales teams to monitor critical metrics like revenue, sales pipeline, conversion rates, and win-loss ratios in real-time. By visualizing this data, organizations can identify top-performing products, regions, or sales representatives. According to a McKinsey report, organizations that leverage analytics in sales performance see a potential revenue increase of up to 15% to 25%.
Customer Segmentation
By analysing customer behaviour and purchase patterns, businesses can create detailed customer segments that inform personalized marketing campaigns. Segmenting customers allows marketing teams to tailor offers and communications, increasing campaign effectiveness by up to 30% according to industry benchmarks.
Lead Scoring
Integrating Power BI with CRM systems, such as Salesforce or Dynamics 365, helps sales teams score and prioritize leads based on historical interaction data. This leads to improved lead conversion rates, as teams can focus on high-potential clients. Businesses that utilize lead scoring experience conversion rates 2-3 times higher than average.
2. Financial Analysis and Budgeting
Financial Reporting
Power BI automates financial reporting by consolidating data from multiple systems into a single dashboard, covering income statements, balance sheets, and cash flows. This automation reduces time spent on manual data entry by up to 70%, streamlining access to financial insights.
Expense Management
Expense management with Power BI allows managers to track spending across departments in real-time, ensuring budget adherence. By monitoring financial performance continuously, businesses reduce overspending and improve budget utilization by approximately 20%.
Forecasting
Forecasting capabilities in Power BI use historical financial data to project future revenue and expenses. According to Deloitte, predictive analytics can improve financial forecasting accuracy by as much as 60%, enabling better resource planning and investment decisions.
3. Operational Efficiency
Supply Chain Monitoring
Power BI empowers supply chain managers to visualize inventory levels, demand forecasts, and supplier lead times, enabling them to optimize supply chain performance. By improving demand visibility, organizations can reduce inventory holding costs by up to 20% and mitigate supply chain bottlenecks.
Production Metrics
In manufacturing, tracking production metrics like downtime, throughput, and defect rates with Power BI minimizes operational disruptions. With this data-driven approach, businesses report up to a 30% improvement in production efficiency, enhancing overall profitability.
Project Management
Power BI dashboards enable project managers to track project timelines, resource allocation, and task progress. This visibility into project metrics reduces the risk of budget overruns and delays, with nearly 77% of high-performing projects using such analytics tools to meet their objectives.
4. Human Resources and Workforce Analytics
Employee Performance Tracking
HR departments use Power BI to track employee performance KPIs, training completion, and productivity rates. Identifying high performers and areas needing improvement enhances team morale and reduces turnover. Companies using analytics for performance management report a 10% to 20% productivity increase among their workforce.
Recruitment Analytics
Power BI helps optimize recruitment by tracking metrics like time-to-hire, cost-per-hire, and candidate demographics. Analysing this data enables HR to improve hiring strategies, saving up to 15% in recruitment costs while reducing time-to-hire.
Employee Retention
Retention analytics in Power BI monitor turnover rates and examine factors like job satisfaction, tenure, and exit interview insights. By identifying retention trends, HR can implement proactive measures, potentially reducing turnover rates by 25% or more.
5. Healthcare Analytics
Patient Care Analysis
In healthcare, Power BI assists in tracking patient outcomes, wait times, and resource utilization, thus improving care delivery. Hospitals that employ analytics for patient care report a 12% to 15% improvement in patient satisfaction and a reduction in average wait times.
Resource Management
Tracking the availability and utilization of hospital resources, such as beds, equipment, and staff, enables efficient resource allocation, helping hospitals maintain optimal service levels. Data-driven resource management has been linked to up to a 20% increase in operational efficiency.
Operational Efficiency
Healthcare providers use Power BI to monitor metrics like readmission rates and discharge times, identifying areas for improvement. Optimized operational metrics contribute to enhanced patient outcomes and financial savings, with some hospitals reporting savings of up to $1 million annually.
6. Retail and E-Commerce
Inventory Management
Power BI’s inventory management dashboards help retailers maintain optimal stock levels, predict demand, and avoid both stockouts and overstocking. Data-driven inventory control reduces holding costs and lost sales opportunities, leading to up to 15% inventory cost savings.
Customer Purchase Analysis
Retailers can track customer preferences and purchase history, allowing them to develop personalized marketing strategies. This targeted approach can boost conversion rates by 10% to 30% and drive customer loyalty.
Sales Trend Analysis
Using Power BI to analyse seasonal and regional sales trends enables retailers to adjust their marketing strategies and inventory to meet demand. Businesses that leverage sales trend data typically achieve a 20% increase in sales during peak seasons.
7. Government and Public Sector
Public Health Monitoring
Public health agencies use Power BI to track vaccination rates, disease outbreaks, and healthcare resource availability. Real-time health data helps governments implement timely interventions, potentially reducing outbreak response times by up to 40%.
Crime Data Analysis
Law enforcement agencies leverage Power BI to analyse crime data geographically, allowing for data-driven allocation of resources. Analytics-driven policing strategies have been shown to reduce crime rates by approximately 10% to 20%.
Budget Allocation
Power BI helps government bodies visualize spending across departments, ensuring effective use of public funds. Transparent budget tracking helps agencies reduce unnecessary spending, with data showing a potential 15% savings in government budgets.
8. Education and Academic Institutions
Student Performance Tracking
Power BI enables educational institutions to track student performance metrics, helping identify areas where additional support is needed. Schools that use data-driven performance tracking see improved student outcomes, with graduation rates increasing by 10% to 15%.
Resource Allocation
Education administrators use Power BI to monitor the allocation of resources like classrooms and faculty, ensuring effective use of facilities and staff. Optimized resource allocation reduces administrative costs and improves student satisfaction.
Enrolment and Retention
By tracking enrolment and retention data, educational institutions can refine recruitment efforts and retention strategies. Schools that implement data-driven retention initiatives report a 5% to 10% increase in student retention rates.
9. Energy and Utilities
Energy Consumption Analysis
Energy companies utilize Power BI to monitor energy usage patterns across different regions or customer segments. By analysing this data, providers can optimize energy distribution, potentially reducing operational costs by 10%.
Outage Management
Power BI dashboards assist in outage tracking and response times, helping utility companies identify and address issues quickly. Effective outage management through analytics can reduce downtime by up to 20%.
Customer Usage Analytics
Utilities leverage customer usage data to provide insights on energy-saving opportunities, improving customer satisfaction and reducing energy waste. Energy companies that use usage analytics report a 15% to 20% increase in customer satisfaction.
10. Transportation and Logistics
Fleet Management
Logistics companies use Power BI to monitor fleet metrics such as fuel usage, maintenance needs, and delivery performance. Improved fleet management through data analytics can reduce fuel costs by 10% to 15%.
Route Optimization
By analysing delivery routes and traffic patterns, Power BI enables logistics companies to reduce travel time and fuel consumption. Route optimization can cut transportation costs by as much as 20%.
Supply Chain Visibility
Power BI dashboards provide end-to-end visibility of the supply chain, helping logistics managers identify bottlenecks and improve supply chain resilience. Enhanced visibility can reduce lead times by up to 15%.
Conclusion
Power BI has proven to be a powerful tool for transforming raw data into actionable insights across multiple sectors. From enhancing sales performance and financial management to optimizing supply chains and improving healthcare outcomes, Power BI equips organizations with the data-driven capabilities they need to make informed, timely decisions. By embracing Power BI, businesses not only improve efficiency and profitability but also foster a culture of continuous improvement and innovation.
Organizations ready to harness data as a strategic asset can look to Power BI as an essential tool for sustainable growth and competitive advantage.


